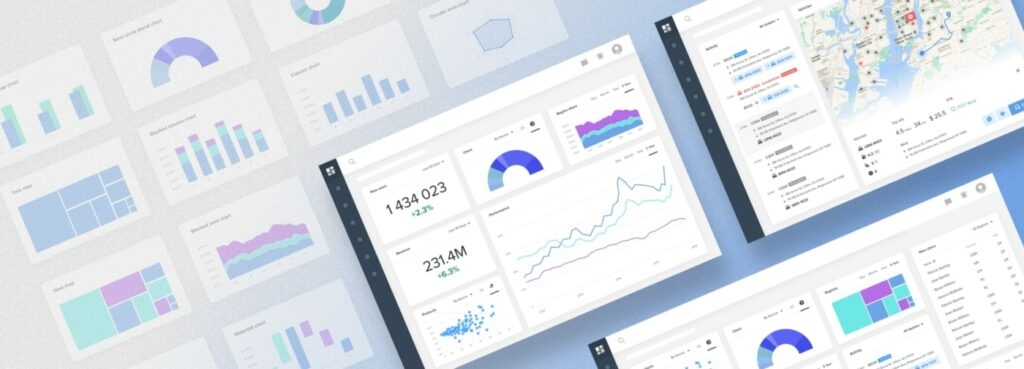
Not only is the dashboard design a stunning representation. The most important information is shown on the app’s interface straightforwardly.
Advice for Creating an Efficient Dashboard
Think About Your Audience
Your audience should be one of the most significant considerations when using best practices for dashboard design. To design the finest analytical tool for them, you must understand who will use the dashboard and for what reason. At the same time, hiring a team of professionals from Relevant Software to make development easy and fast. You must put yourself in your audience’s position to accomplish this effectively. The environment and platform where consumers visit their dashboards daily will directly affect how the information is presented. Will the dashboard be watched while traveling, in solitude at a desk in an office, or projected as a presentation in front of a huge crowd?
Set the Scene
How will you know whether those data are good or terrible, or if they are average or uncommon, without giving context? Consumers cannot evaluate the numbers on a dashboard without comparisons. Furthermore, they won’t be able to determine if any action is necessary. For instance, the design of a management dashboard will be centered on high-level metrics that are simple to compare and, as a result, provide a visual narrative.
Think About the Application to Digital Versus Exporting
You must consider exports as part of the dashboard design process. The dashboard itself may be used and shared, but if you want to use exports often, you may want to optimize for printing constraints, fewer colors, and various line styles to ensure that everything is legible, even on a black-and-white printer. Therefore, while designing your data dashboard, you should also consider how to optimize for various exporting choices or share the dashboard itself with all of its features and options.
Share a Story
This means that your report will be “read” by its audience, probably from the top left to the bottom right, much like a page of a book. That’s just how our minds are constructed. As a result, check that the report has some consistency in terms of the queries you display where. Additionally, consider combining queries that provide information about the same subject, activity, or KPI. The first page of many reports with many pages will often be a kind of overview of the key headlines, while the subsequent pages will be devoted to certain topics and go into further detail.
Show Hierarchy With Size and Position
Your dashboards are simpler to browse when a hierarchy is introduced. Utilize size and location to draw attention to the most crucial information and minimize metrics that should only be examined occasionally. It will be easier to build patterns and a visual flow if components have consistent sizes and obvious connections. Since your eyes are pulled there first naturally, the top left corner of your dashboard is the optimal place for placing. Be not terrified of emptiness. Leaving a space is preferable to creating something larger only to fill one.
Use Color Carefully
This means you shouldn’t go overboard and start picking a new color for every visualization. Make as little use of color as you can. You might use various colors to denote different sections of your report, for example, one color for anything related to sales and another for marketing, etc. but only in situations when it makes sense. I suppose a rule would be to use the same color in more than one visualization in the report if you use a different color. On the other hand, the finest reports and dashboards tend to keep their color schemes fairly straightforward.
Select your Objectives
The user’s wants and the dashboard’s function, which is to set your final objectives, are directly related to UI design principles. Every dashboard you create, whether it’s for a client or an internal report, will have a goal and use the data to address crucial issues. It is important to remember that not all of the data provided will be pertinent for the analysis process and that if you get this step wrong, your subsequent efforts may be for naught.
Conclusion
What therefore constitutes a decent dashboard? An efficient data dashboard should be eye-catching but aesthetically balanced, clever yet simple, approachable, user-friendly, and customized to your aims and audience. The aforementioned dashboard design suggestions work together to provide a certain procedure that will enable you to create visuals that will greatly improve your data analysis efforts.